



The pandemic-era, remote-work-enabled migration of millions of Americans from expensive coastal metros to the Mountain West and Sunbelt supercharged local housing markets in 2021 and 2022. As wealthier, higher-paid out-of-towners bid up limited inventory, nowhere was the Zoom Boom bigger than in Austin. Between early 2020 and its June 2022 peak, single-family home prices in the Austin area rose more than 70%—far outpacing the roughly 56% average gain among ten comparable pandemic boomtowns, from Boise to Charlotte to Salt Lake City.1 Meanwhile, Austin’s multifamily rent boom was slightly below average, rising 28% versus 31% in the peer group. Only the depth of its fall was exceptional: since peaking in 2022, home prices are nearly 27% lower in Austin versus 8% in other boomtowns, while rents are down 16% against just 4% in the rest of the group.2
What makes Austin, if you’ll forgive me, so weird?
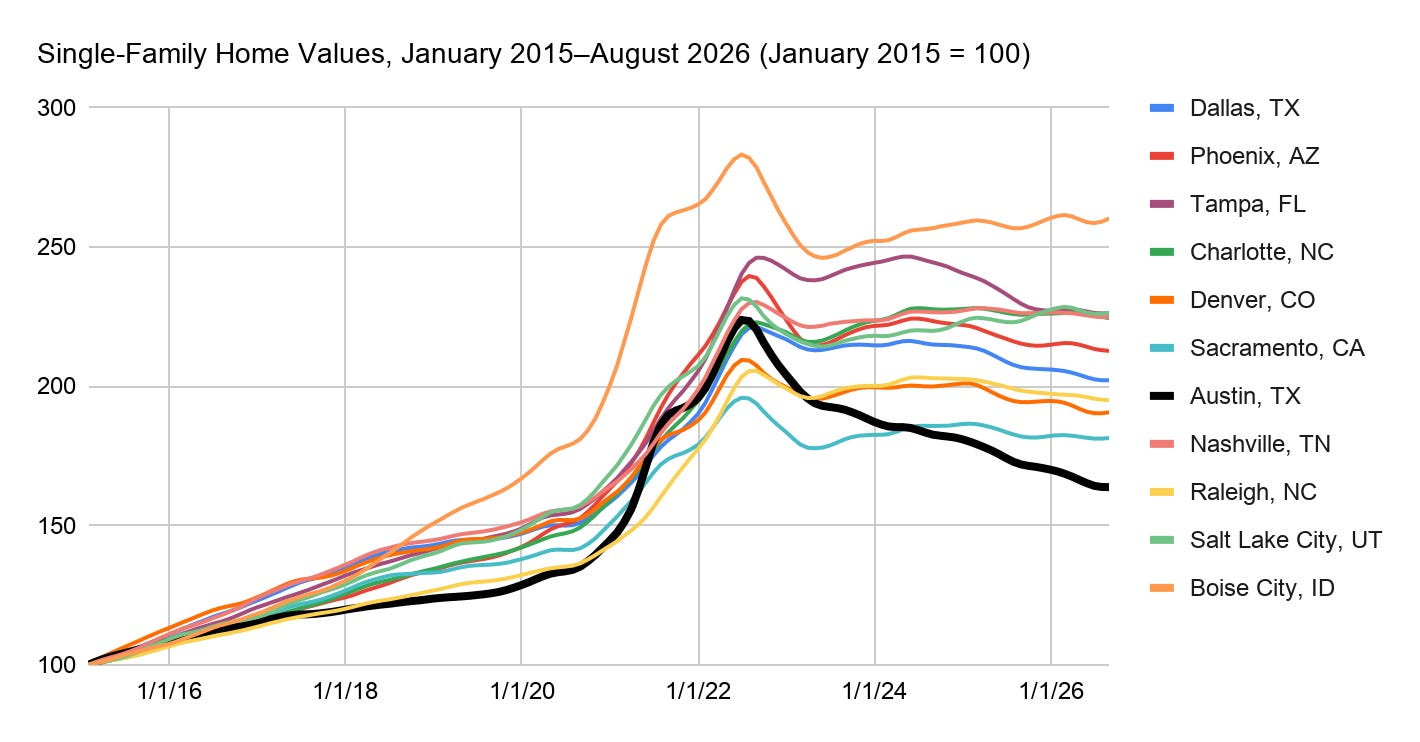
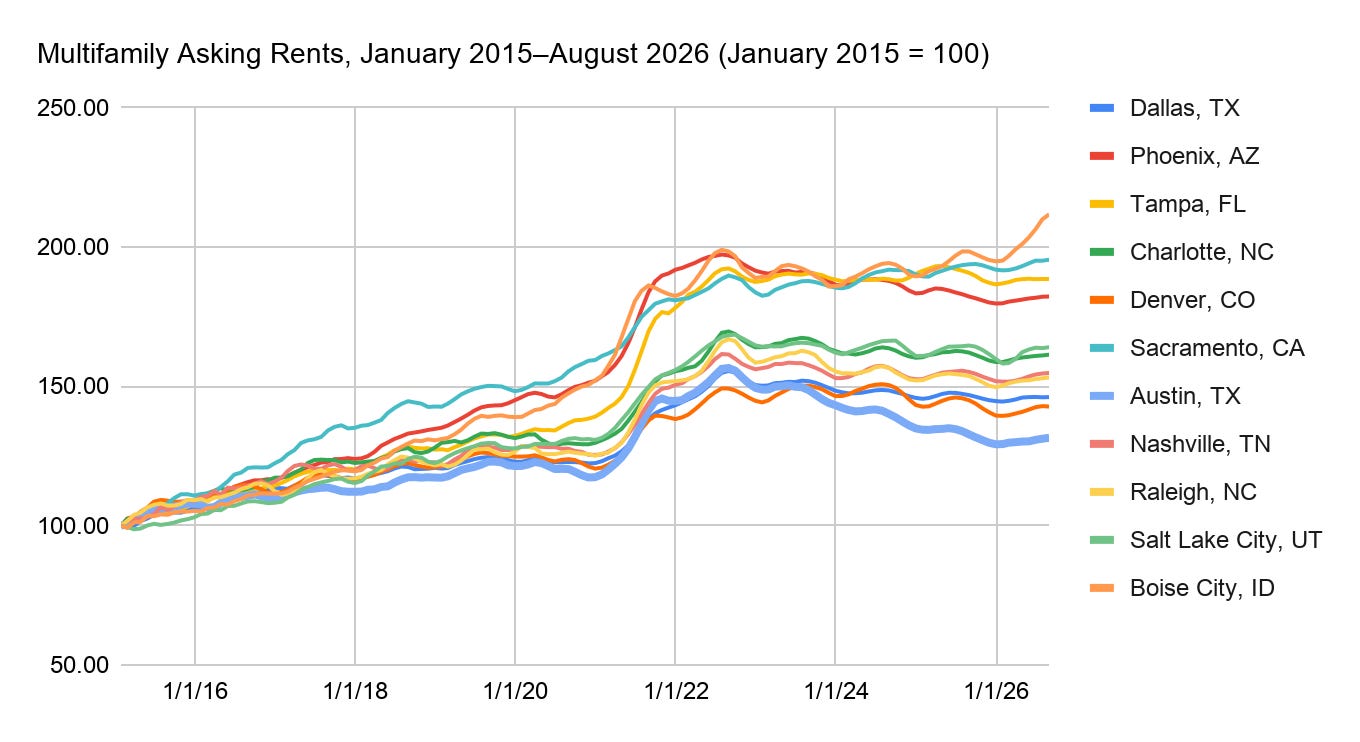
Austin’s extreme boom and bust have made it a frequent case study of late. A Pew Charitable Trusts report credits pre-pandemic policy reforms with the drop in housing costs, an interpretation celebrated by YIMBYs as vindication for loosening restrictions on housing construction. Recently, my friend Andrew Burleson argued that this account is too simplistic and too triumphalist. Those pushing a simplified “build apartments → rent goes down” story risk losing credibility, he writes, because they ignore Austin’s demand collapse and misrepresent an ordinary market correction as a supply-side policy victory. The more defensible claim, in his view, is that zoning changes shaped where Austin’s growth went, not whether prices fell.
Andrew’s piece has been living rent-free in my head for the past three weeks.3 He’s absolutely right that demand cannot be ignored. Living here in Austin, it’s easy to get caught up in the supply narrative when there has been so much apartment construction everywhere. But the “For Sale” signs hanging forlornly outside neighbors’ houses are reminders that the overall boom has gone bust. Still, I found his account of the demand side incomplete and his more narrow claim too dismissive of the role of supply. So, this is my attempt to answer Andrew’s good faith argument in the same spirit, by telling a more complete story about what actually happened in Austin. Is it supply? Is it demand?
The answer is yes—it’s both. Let’s start with demand.
The Texodus That Wasn’t
Andrew’s evidence starts with the California influx: some 20,000 Californian households moved to the Austin metro area in 2020 and 2021, bringing much higher salaries than in-state movers, per data from the Texas Real Estate Research Center. Andrew then explains that many of those ex-Californians also moved out: “By 2023, this reversal was well-understood locally. The inflow of new residents slowed to a trickle, and by September more people were moving out of Austin than moving in.” As evidence of a reversal, Andrew points to negative domestic migration from Travis County in 2023 and 2024, as well as a Redfin chart from October 2023 that shows the number of homebuyers looking for homes outside of Austin outpacing those looking to buy in Austin in one month, September 2023. There are a couple problems with this.
The Redfin chart measures searches on Redfin.com, not completed moves: Redfin counts someone as a “migrant” if the user viewed at least ten homes during the relevant period and at least one was outside the user’s home metro. I look at real estate listings all the time for summer homes I can’t afford, but that does not make me a migrant to the Hamptons.
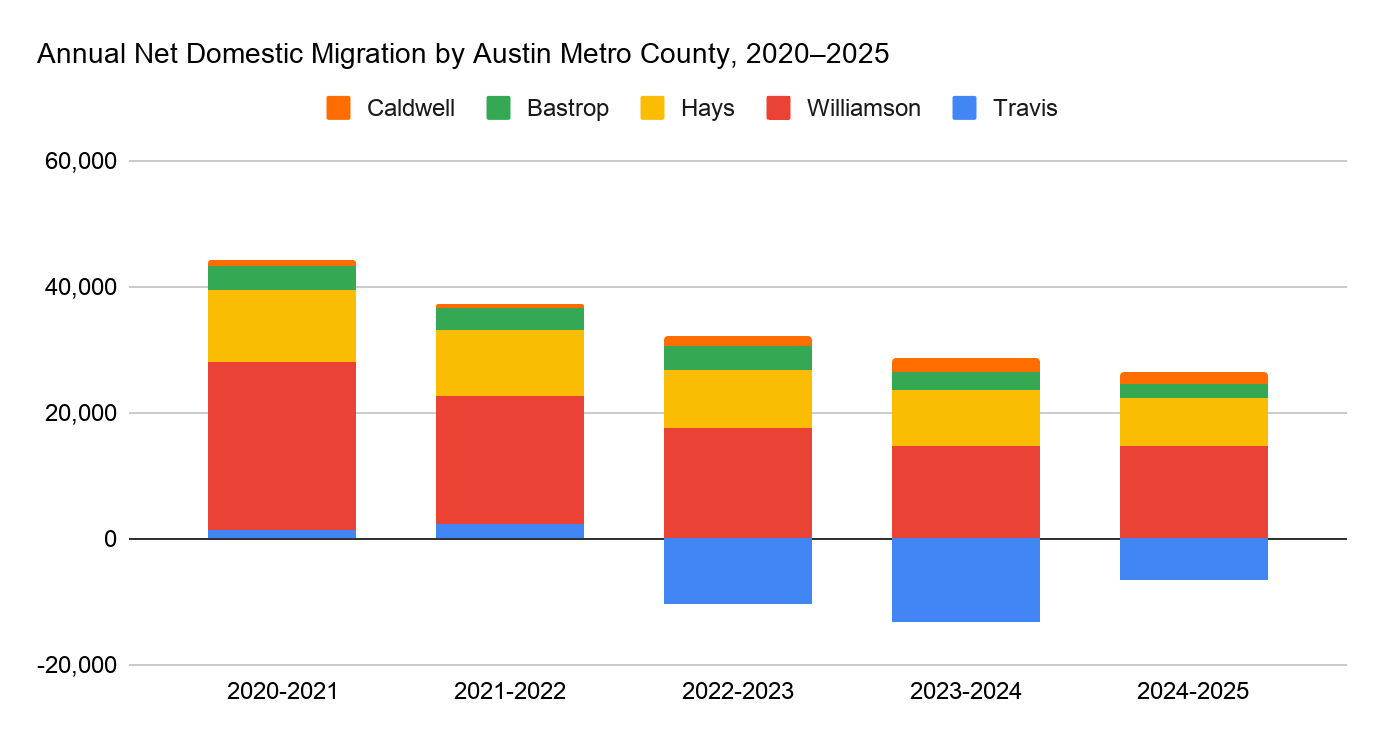
The Travis County data hides a more complicated story. Travis County is not the City of Austin, nor do its domestic migration losses establish an exodus from the metropolitan area. Despite losing a net 13,504 residents to other parts of the country in 2023 and 2024, Travis County’s population still grew by 1.2%. Meanwhile, domestic migration added 28,000 people to the metro’s four other counties—more than twice Travis County’s net loss. If we look at this data over a longer time horizon, we see that Travis County lost population to domestic migration from 2022 through 2025, while domestic migration into the other four counties slowed. Nevertheless, thanks to births and international migration, Travis County grew more than 7% over the period, while the four other counties each grew more than 20%. Domestic migration into the region slowed, and undoubtedly some pandemic transplants returned to the coasts, but the pattern is also consistent with some Travis County out-migrants moving to the surrounding counties. Meanwhile, the city of Austin itself crossed one million residents in 2025. The Census data show metro-area growth, not a region-wide exodus.4
The Household Shock
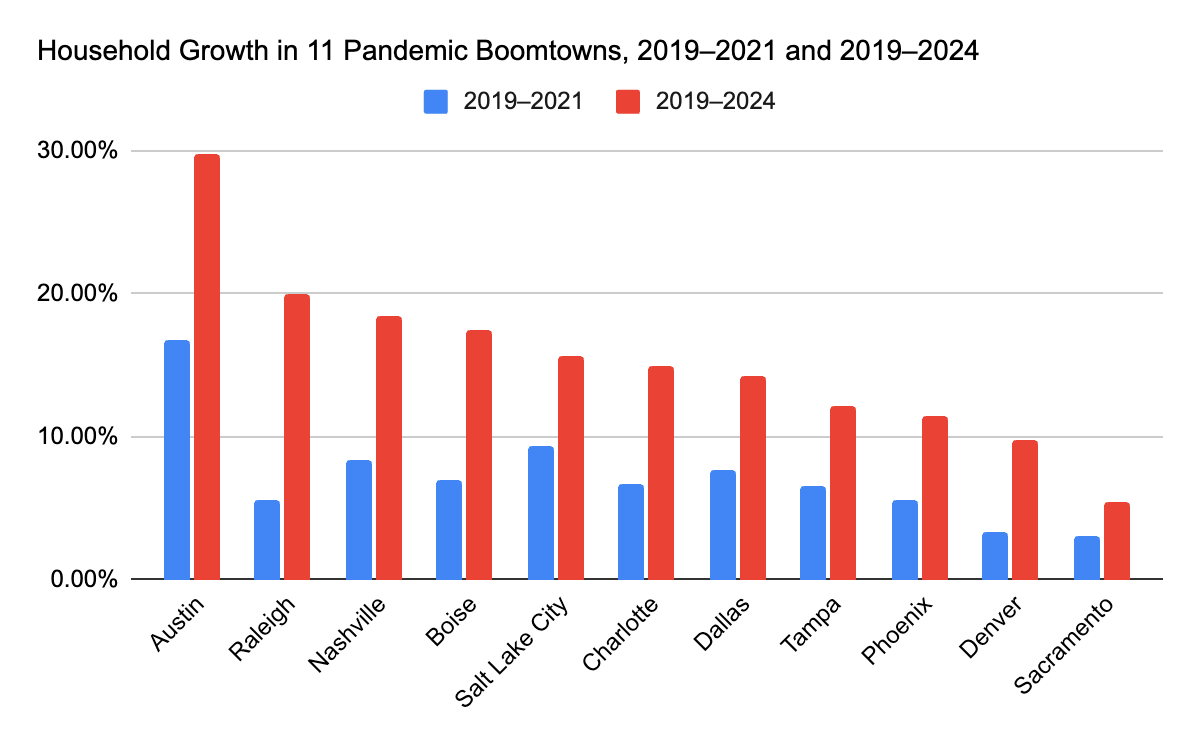
Housing demand is more directly a function of household formation than raw population growth. A new baby doesn’t need its own home, nor does the death of a spouse eliminate the surviving spouse’s need for shelter. Conversely, when roommates separate, adult children leave the nest, or couples divorce, demand for housing increases even if the overall population remains the same. You can see the scale of that shift in Austin in the Census data. Between 2019 and 2024, the Austin metro area’s population grew about 12.4%, while its households grew 29.7%; average household size fell 11.6%, from 2.67 to 2.36. Austin had both the largest household increase and the largest decline in household size of any boomtown in the peer group. Raleigh came closest in household growth, at 20%.5
The shift hit fastest at the start of the pandemic. From 2019 to 2021, the metro added nearly 76,000 people but more than 137,000 households, an increase of 16.8%. The next-largest household increase among the boomtowns was Salt Lake City’s 9.3%. The divergence between population and household growth shows why population growth alone does not explain the demand shock.6
Household formation surged and household sizes fell everywhere, including in cities that lost population. That helps explain why a city like New York could see rental vacancies plummet to historic lows and rents reach historic highs even as it lost half a million people. In the boomtown metros that absorbed those population outflows, migration and shrinking household size operated simultaneously. Measured by household growth, Austin experienced the largest demand shock in the peer group.
Rising Rates, Falling Incomes
As Andrew explains, coastal transplants could leverage Silicon Valley salaries—and, in some cases, home equity accumulated in more expensive markets—to win bidding wars against Texans. Census data show that Austin metro median household income rose during the pandemic, reaching $101,413 in 2023, but that was only 2% higher in real terms than in 2019. It then fell 1.5% to $99,897 in 2024. Within the city, the swing was larger: real median household income rose 3.6% to a 2022 peak of $95,842 before falling 5.6% by 2024.7 The timing and size of those dips in income may help explain part of Austin’s correction, but home prices and rents had already seen their steepest falls from their peaks before the income declines show up in the data. It’s also plausible that the causation ran the other way: Austin’s increasingly affordable rents may have attracted a broader range of household incomes in response to the new supply.
Those median incomes also cannot tell us the specific incomes of the households that arrived or formed during any particular year. What they do show is that as Austin continued adding households, those households had less purchasing power than they did during the pandemic frenzy. This was in part a function of rising mortgage rates; by 2022, the marginal homebuyer faced both higher home prices and much more expensive financing. That loss of purchasing power clearly contributed to the retreat in home values, but it was also not unique to Austin.
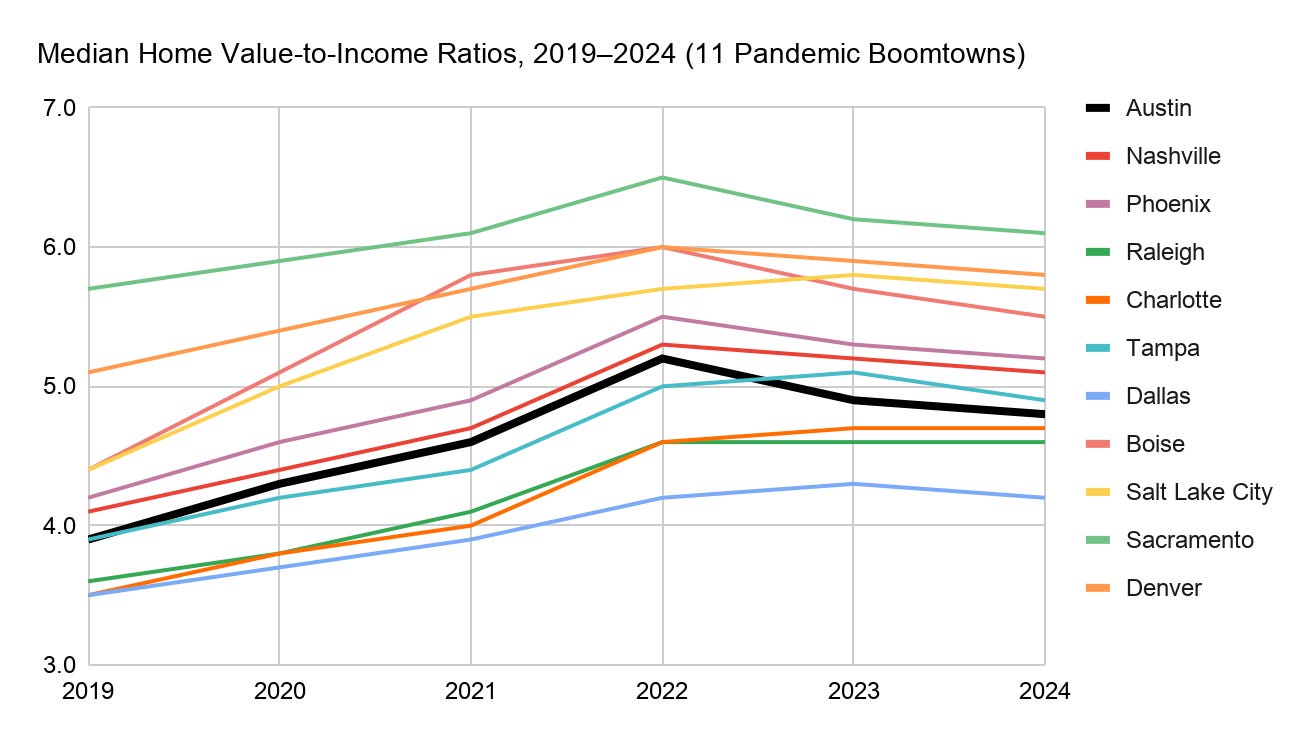
Indeed, Austin wasn’t the only boomtown where the price of homes increased relative to incomes. Among peer metros, Austin’s pre-pandemic median home value to median household income ratio stood at 3.9x, slightly below average compared to Nashville’s 4.1x or Denver’s 5.1x. Austin peaked at 5.2x in 2022—again below average for the group—before landing at 4.8x in 2024, still below average. Nevertheless, the Austin-area home-value-to-income ratio was nearly 23% higher in 2024 than in 2019. But in Raleigh and Tampa the ratio was nearly 28% higher, and in Charlotte more than 32%.8
In other words, home values outran incomes across the boomtowns, while rising mortgage rates reduced purchasing power in all of them. The retreat of exceptionally well-funded buyers from the market and the mortgage-rate shock therefore help explain the correction they shared. But those common forces do not explain why Austin’s reversal—in both home values and multifamily rents—was so much deeper. Something else was happening here.
Supply Catches up to Demand
Austin’s extraordinary demand shock initially met a housing supply that could not adjust nearly as quickly. As the metro area added 17% more households from 2019 to 2021, it added only about 13% more housing units. Those 137,000 households were met by only 114,000 units metrowide, a 23,000-unit gap between household and housing-stock growth. This mismatch wasn’t unique to Austin, but the magnitude of Austin’s household demand shock, coupled with a higher-income marginal buyer, led to a uniquely high rise in single-family home prices. That doesn’t necessarily explain why prices had to fall—or why rents and prices remain so high in most other boomtown cities. What was unique was Austin’s building response.
Between 2015 and 2019, the metro area added about 94,000 households and 98,000 housing units, keeping slightly ahead of new demand. When Covid hit, supply and demand got temporarily but dramatically out of whack (to use a technical term). Builders responded rapidly. In the next three years, even as the metro added another 105,000 households, the metro’s housing stock grew by another 131,000 units, more than offsetting the earlier gap.
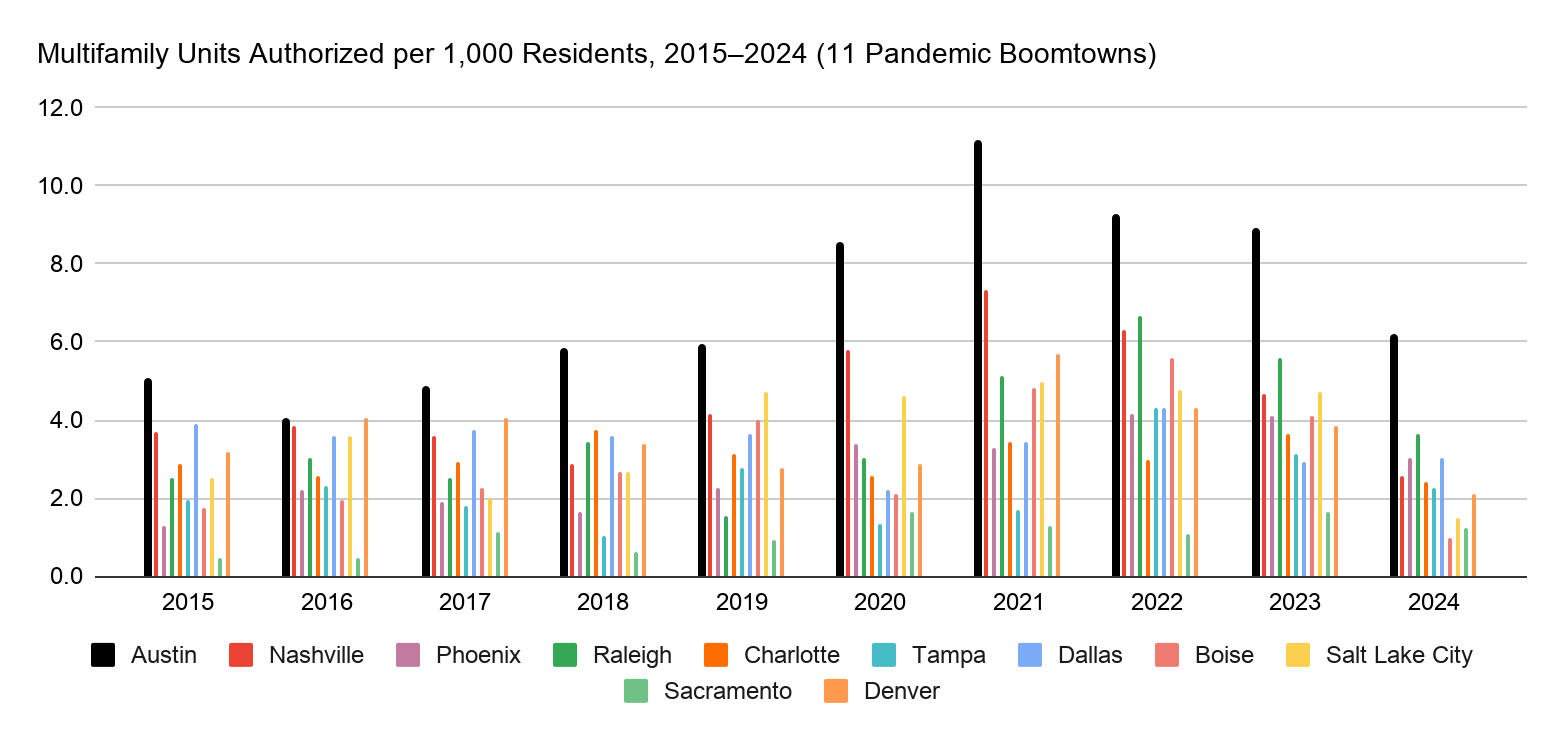
Between 2015 and 2024, Austin consistently authorized more multifamily units per capita than any other metro in the peer group. From 2020 to 2024, it averaged 8.8 multifamily units authorized per 1,000 residents a year—2.5 times the average of 3.5 multifamily units authorized per thousand residents in the other ten boomtowns. The gap was widest at the pandemic peak: in 2021, Austin authorized 11.2 multifamily units per 1,000 residents, more than 50% above the next-highest metro, Nashville, at 7.4.9
When it came to permitted single-family units, Austin metro was above average but never the leader. From 2020 to 2024, Boise led at 9.2 single-family units authorized per 1,000 residents, followed by Raleigh at 8.7 and Austin at 8.3. Austin’s own peak came in 2021, when it authorized 10.4 single-family units per 1,000 residents, its highest of the decade.10
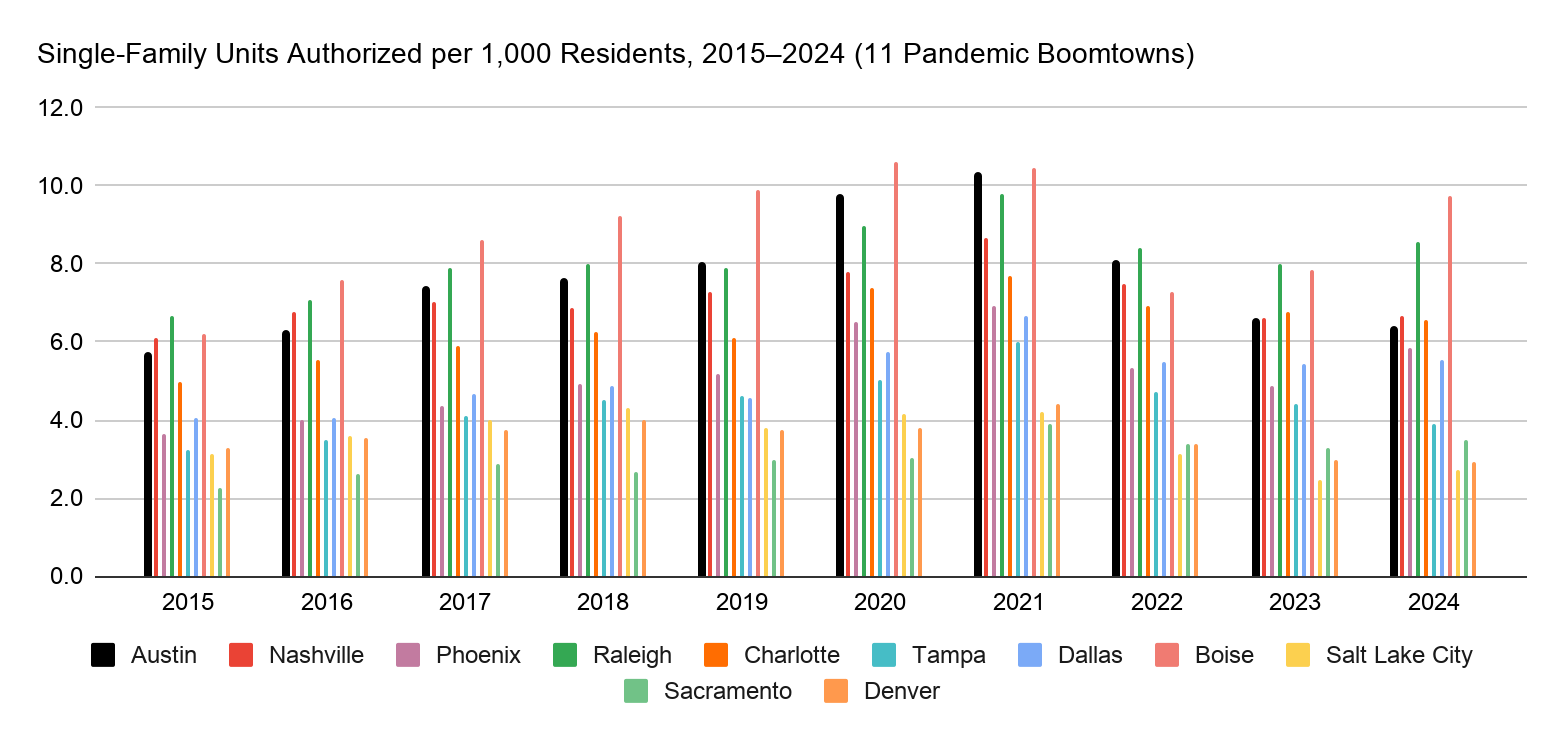
Altogether, from 2019 to 2024, the Austin metro authorized 81% more housing units per capita than the other ten boomtown metros on average. In nine of the ten years since 2015, it authorized more housing units per capita than any other metro in the group, losing only in 2016, when Nashville beat it with 10.6 to 10.3 per thousand residents. Austin unleashed and sustained a building boom.
The Cycle in Motion
One objection to the supply story is that this is just the housing cycle in motion: when demand rises, prices and permitting rise; when demand cools, both prices and permitting retreat. For the housing cycle to work, supply has to be able to respond. When prices rise and builders don’t deliver more housing—because of zoning restrictions, permitting bottlenecks, or other constraints—a demand shock doesn’t produce a building boom but a price ratchet. Every boomtown experienced this pressure, but Austin’s response diverged from peers both in form and magnitude. Austin’s housing market was elastic enough for supply to catch up with, and eventually overtake, its demand shock. The new supply of multifamily housing drove apartment rents downward, which made renting an apartment an increasingly attractive alternative to buying or renting a single-family house.
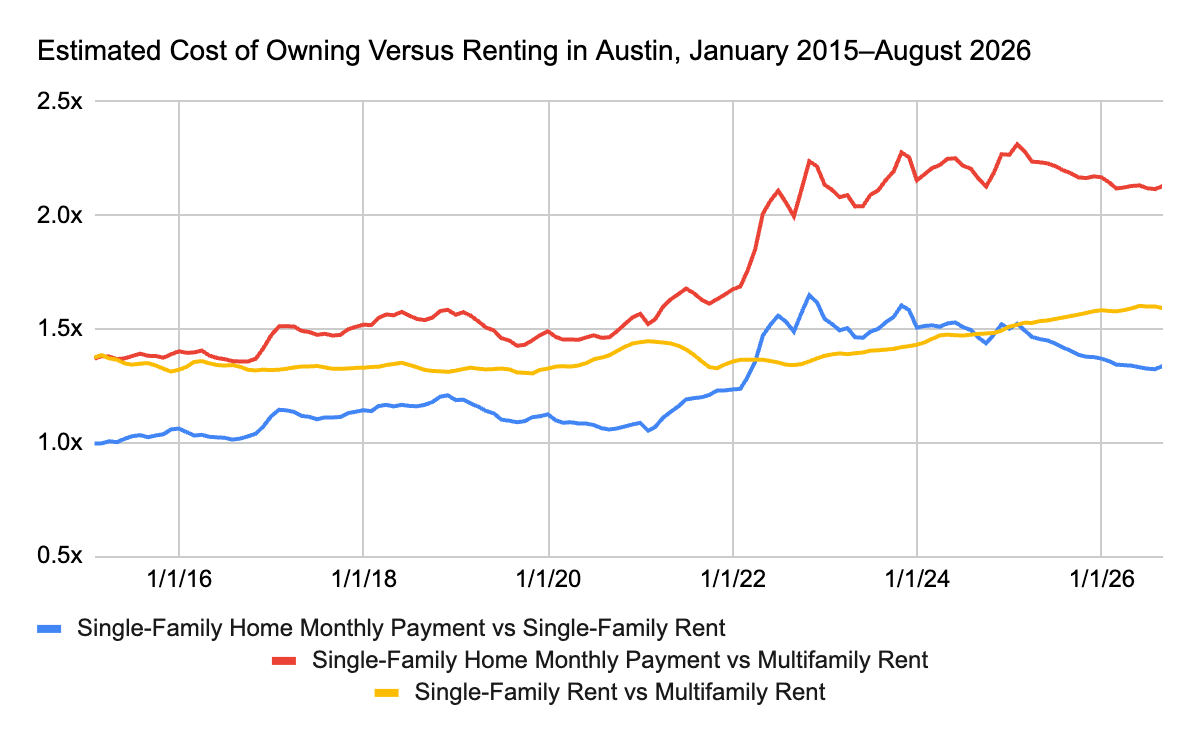
That supply arrived just as pandemic migration slowed and the mortgage-rate shock eroded purchasing power. When home prices began falling in June 2022, higher interest rates actually raised the monthly cost of ownership. Before the pandemic, the estimated monthly cost of owning in Austin was about 45% higher than renting an apartment. By April 2022, owning was twice as expensive. That gap peaked at 131% in January 2025 and remained elevated, hovering at 113% as of August 2026. The ongoing price correction in the for-sale market somewhat reduced the monthly cost of ownership, but not by much—especially when compared to rents.11
Demand for single-family homes didn’t disappear, but some would-be buyers were displaced into the rental market. Before the pandemic, renting a single-family home was only about 9% cheaper than buying one. That gap widened to 65% in October 2022 before declining to about 34% as of August 2026. Austin’s single-family asking rents increased 28.4% between February 2020 and August 2026, and stayed relatively stable after peaking in June 2023. Austin’s single-family rent hike was the smallest of the peer group, and those rents have continued to rise in every other peer metro.12 Meanwhile, some portion of Austin’s would-be homesellers became landlords after struggling to sell homes, increasing the supply of for-rent houses, while the glut of multifamily continued to put downward pressure on rents.
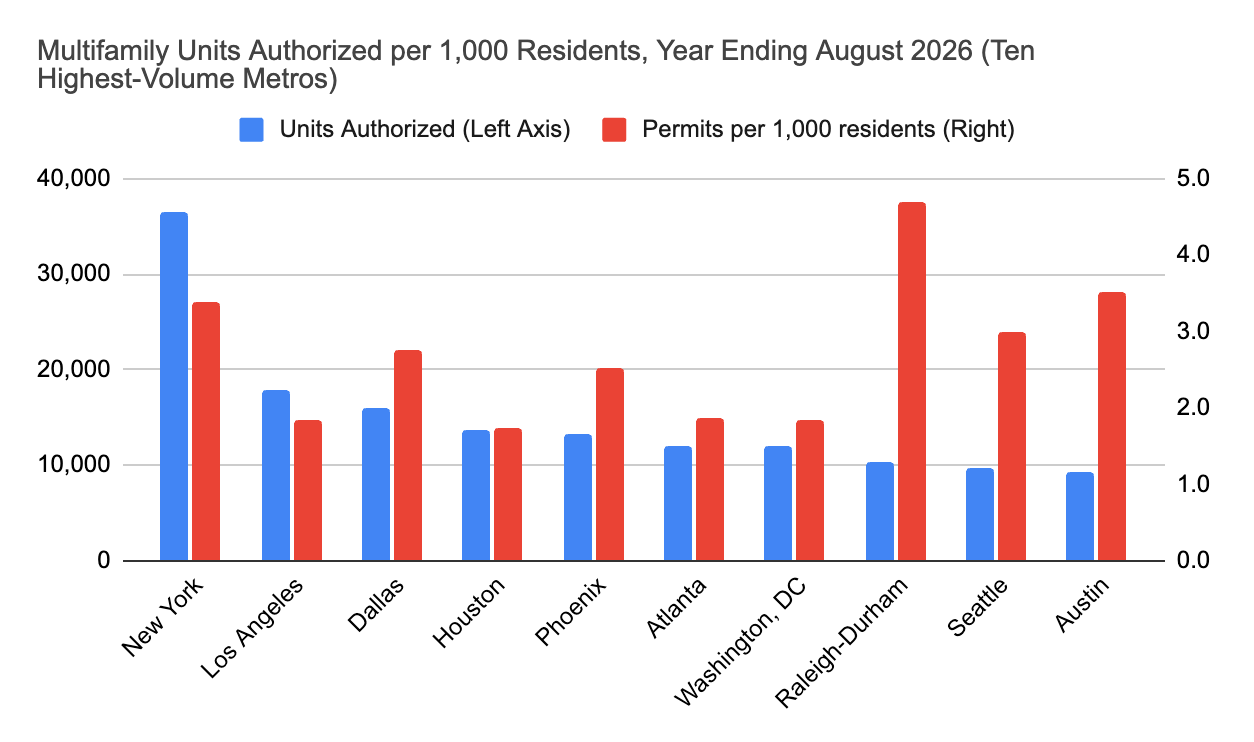
While permitting in Austin has fallen from its pandemic highs, both the City of Austin and the Austin metro area still ranked among the nation’s ten largest multifamily permitting markets for the year ending August 2026, according to RealPage. Among those ten, Austin’s 3.5 multifamily units authorized per thousand residents ranked second only to Raleigh’s 4.7. That’s a steep fall from Austin’s pandemic peak, but it’s not evidence of a policy failure. This is how a housing cycle is supposed to work when supply is allowed to respond to demand: rents and prices are correcting as the market rebalances, builders pulled back as market economics weakened, and now, as the market reaches equilibrium, rents are starting to tick up again.
A housing cycle requires both supply and demand to work.
Yes In My Backyard or Simply Texas?
Why did Austin build so much? The housing boom can be told as a tale of two Austins. The City of Austin’s housing stock grew by approximately 121,000 units between 2015 and 2024, while the surrounding suburbs added about 222,000 units to their housing stock.13 Beyond city limits, abundant land in unincorporated areas and permissive suburban development regimes allowed for a lot of greenfield growth. This has been a recipe for Texas sprawl, but it’s also a major reason why the metro area was able to rapidly respond to the demand shock.
Within the city, growth was enabled in part by pro-housing reforms already in place before the pandemic. These included policies facilitating higher-density mixed-use buildings, targeted upzonings in and near the central city, reforms making accessory dwelling units easier to build, and funding and density bonuses for income-restricted housing. Developers still complain about the difficulty of building in Austin compared to other Texas cities, but it has generally been easier to build here than in expensive coastal cities, as recent research demonstrates. Together, suburban expansion and apartment-friendly city policies gave the metropolitan housing market room to respond.
One thing that consistently confuses the Austin narrative is that the City of Austin passed major supply-side reforms beginning in 2023 that allowed three homes by right in single-family zones, rolled back compatibility restrictions that limited apartment height near single-family homes, cut minimum lot sizes, and eliminated parking requirements citywide. These reforms were rightly celebrated, but because they coincided with the decline in rents and prices, some have mistakenly credited them, instead of the pre-pandemic reforms, with that correction. Nevertheless, the newer reforms are already having an effect, and some 1,421 homes have been approved under the three-unit-by-right rule—but these are forward-looking tools, not the primary cause of the earlier decline.
The Work Is Not Done
Andrew concludes that “adopting this Austin story as a simplified shorthand for success, when locals are still being priced out, and rents and prices in Austin are starting to climb again, seems likely to cost housing advocates credibility.” He’s right that the work isn’t done—which is painfully obvious to those of us on the ground here in Austin doing it. If anybody is running victory laps, it’s because we succeeded in passing a lot of difficult reforms locally. We know that rents and home prices remain elevated over pre-pandemic levels, and that Austin still builds too little housing suited to families, a concern sharpened by declining public-school enrollment. City planners are developing ordinances to address the shortage of “missing middle” housing, but there is much more work to be done to address deep affordability for those struggling at the bottom.
What actually happened in Austin? Andrew is right that Austin’s story simply isn’t “build apartments → rent goes down” and that a triumphalist narrative understates the role of demand. But an incomplete demand narrative also isn’t enough. Austin’s demand shock and subsequent slowdown is more complicated than the population reversal he describes. What Austin saw was extraordinary household growth that far outpaced population growth, followed by a slower—but continuing—increase in households. Meanwhile, every boomtown’s marginal homebuyer saw an erosion in purchasing power as mortgage rates rose and home values outran incomes. That helps explain why home values fell across the board, but it doesn’t explain why Austin’s correction went so much further.
What set Austin apart was supply. Austin answered the demand shock in the suburbs through a Texas sprawl free-for-y’all, and in the city through pre-pandemic rules that allowed apartments to pencil out. Together, that produced an unusually rapid supply response, particularly in multifamily housing, and ultimately gave Austin renters far more relief than renters in the other boomtowns. It is not a total victory, but it is a win worth celebrating. Any credible account of Austin must weigh both supply and demand—but let’s give due credit to Austin’s extraordinary supply, too.
City of Yes is a reader-supported publication. If you find this work valuable, please consider becoming a paid subscriber. Thank you for your support!
The boomtown peer group includes Boise, Charlotte, Dallas, Denver, Nashville, Phoenix, Raleigh, Sacramento, Salt Lake City, and Tampa. Data is presented at the metropolitan area level unless otherwise specified.
Home value data is derived from the Zillow Home Value Index (ZHVI) while monthly rent data is derived from the Zillow Observed Rent Index (ZORI), both downloadable at https://www.zillow.com/research/data/.
That’s how far rents have fallen in Austin!
Source: U.S. Census Bureau, Population Estimates Program, Vintage 2025.
Source: U.S. Census Bureau population estimates. City and metro values use corrected intercensal series through 2019 and Vintage 2025 estimates beginning in 2020. Household data is from the Census American Community Survey (ACS). Standard 2020 ACS 1-year estimates were not released; 2025 ACS data are not yet available.
Source: ACS.
Real median household income is from the ACS.
Median household income and median owner-occupied home value are from the ACS.
Permit data comes from the Census Building Permits Survey. Multifamily includes units in 2-unit, 3-to-4-unit and 5+-unit structures.
Source: Census Building Permits Survey.
Comparison derived from Zillow’s single-family and multifamily ZORI series and its estimated total monthly ownership payment series. ZORI measures quality-adjusted asking rents. The ownership estimate assumes a 20% down payment and includes mortgage principal and interest, property taxes, homeowners insurance, and estimated maintenance.
Source: Zillow (as above).
Source: ACS.